Items Comparison By Revenue Centers
Last updated
Last updated

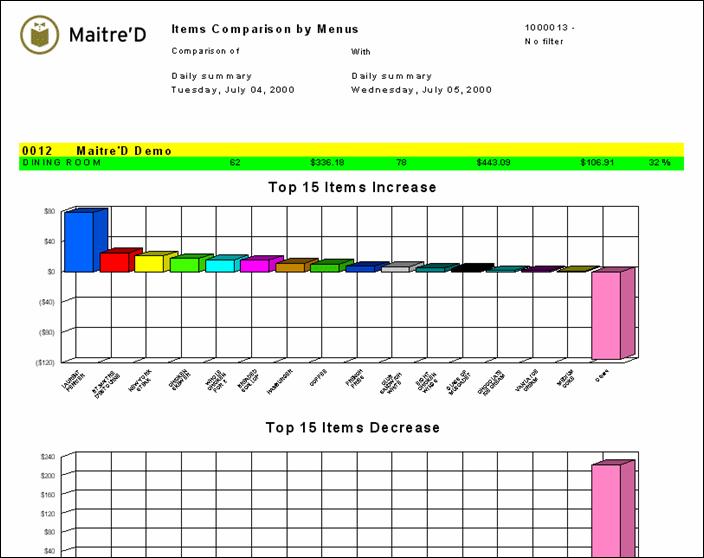
Maitre'D Items comparison by Revenue Center report compares item gross sales by category for each Revenue Center. The graphic shows you the gross sales variation for the 2 dates or the 2 dates range period selected. The graphic is divided in 2 sections: top 15 items increase and top 15 items decrease. One section provides you with 15 items that had the highest increase in variation and the second one provides you with 15 items that had the most decrease in variation. From a report filter window, you select the appropriate dates or date range, the appropriate comparison date or date range, category, division, Revenue Center and mode for which you need information. The following is a sample of the Items comparison by Revenue Center report:
You get a detailed list of all the information shown on the graphic for the 2 dates or the 2 period of time selected. The items are sorted in numerical and alphabetical order. The item # precedes each item. The first set of columns shows information on the fiscal date and the second set of columns shows information on the comparison date.
For each item find:
Quantity:
Quantity of item sold (applies to the fiscal and comparison date)
Amount:
Item gross sales (applies to the fiscal and comparison date)
Variation:
Comparison date $ amount LESS fiscal date $ amount
Variation%:
Variation divided by the $ amount (from the fiscal date) multiply by 100
Take note: a total quantity, $ amount, variation and variation % shows up at the top of the graphic. This total includes all items belonging to the category.